Introduction
The Microsoft Chart controls are a series of classes in the System.Web.UI.DataVisualization.Charting namespace that allow web developers to ability to add charts to their ASP.NET applications. The most pertinent charting-related class is the Chart class, which contains information about the chart's appearance, series, charting areas, and so forth. In most of the demos and code samples we've explored thus far, we've used the Chart class as a Web control, adding the <asp:Chart> declarative markup to our ASP.NET page, setting a few properties and, occasionally, writing a few lines of code. When used as a Web control, the Chart class both creates the chart (as an image) and then renders an <img> element that points to the generated chart image.
Using the Chart Web control is a standard practice in a WebForms application, but it is not suggested when building an ASP.NET MVC application. (While it is possible to add Web controls - including the Chat Web control - to the views of an ASP.NET MVC application, it is generally frowned upon.) So, if we can't use the Chart Web control in an ASP.NET MVC application, how do we display a chart? In addition to being used as a Web control, the Chart class can also be used programmatically. It is quite possible to create a new Chart object, set some properties, plot the data points, and then generate the chart image. In fact, we looked at using this technique in an earlier installment, Programmatically Generating Chart Images, in which we saw (among other things) how to generate chart images programmatically and add them as attachments in an email message.
This article explores how to display charts in an ASP.NET MVC application. Read on to learn more!
An Overview of Displaying Charts in an ASP.NET MVC Application
Using the Chart Web control in an ASP.NET WebForms application typically involves adding the Chart control to a page, setting a few properties and, perhaps, writing a few lines of code. When a visitor arrives at such a page, the Microsoft Chart Controls take the data to be plotted, dynamically generates an image, and then stores this image either in memory. The Chart Web control itself doesn't return the binary contents of the image; rather, it renders an <img> element whose src attribute points to a file named ChartImg.axd, which grabs the just-created image file from memory and returns it. (This is a bit of an oversimplification and does not describe all of the possible ways the Chart Web control can generate and serve the chart image; refer to the Rendering the Chart article for a more in-depth examination on this topic.)
In an ASP.NET MVC application we do not have the Chart Web control or the ChartImg.axd file at our disposal. Instead, we are on the hook for:
1. Defining a URL that, when visited, plots the chart data, generates chart image, and returns its contents, and
2. Adding the HTML to our views to display the chart image
Consider an ASP.NET MVC application that displays sales data charts from the Northwind database. One chart of interest is the annual sales chart, which displays the total sales for all products in a specified category for a specified year (such as the total sales for all Beverages products in 1997). Our first step to displaying such a chart would be to define a URL that, when visited, would return the corresponding chart image. You have total flexibility in the URL pattern you choose to render a report. I like to create a controller named Charts with actions for each type of chart I offer, using querystring parameters to indicate the input parameters for the chart (if any). In other words, for the annual sales chart I'd use a URL pattern like Charts/SalesByYear?CategoryName=CategoryName&OrderYear=Year. With such a pattern in place, visiting www.yoursite.com/Charts/SalesByYear?CategoryName=Beverages&OrderYear=1997 would return the contents of an image file that displays the annual sales data for 1997 for those products in the Beverages category. Bear in mind that this URL returns just the image contents and not any other markup. To display the chart in a view you would add an <img> element to the view, like so:
<img ... src="/Charts/SalesByYear?CategoryName=Beverages&OrderYear=1997" />
I've created an ASP.NET MVC 2 application using C#, Visual Studio 2010, and ASP.NET 4, which is available for download at the end of this article. The remainder of this article shows how to display charts in an ASP.NET MVC application by walking through some of the more interesting aspects of this demo application.
Creating the Charts Controller and SalesByYear Action
In ASP.NET MVC, incoming URLs are mapped to actions, which are methods in a controller. Typically, actions return the HTML markup rendered by a view, but actions can actually return any kind of markup, including plain text, JSON, and binary content. In other words, it's quite possible to create an action that returns the binary contents of an image.
To display charts in an ASP.NET MVC application we need to create an action that returns the binary contents of a specific chart image. As I noted earlier in this article, I like to put all of my chart-generating actions in a single controller named Charts. The name of the action determines the URL that will be used to view a chart image. For example, in the demo application I created an action in the Charts controller named SalesByYear. A simplified version of this action is shown below:
public class ChartsController : Controller
{
public ActionResult SalesByYear(string categoryName, int orderYear = 1995, bool showTitle = true)
{
...
}
}
Note that this action takes three input parameters: categoryName, orderYear, and showTitle. These input parameters are automatically assigned the values of the querystring parameters with a matching name. If a visitor requests the URL Charts/SalesByYear, without specifying any querystring parameters, the three input parameters will be assigned their default values - null, 1995, and true, respectively. However, if appropriately named querystring fields are present in the request, such as Charts/SalesByYear?CategoryName=Condiments&OrderYear=1996&ShowTitle=false, then the three input fields will be assigned those values - Condiments, 1996, and false, in this example. (The showTitle input parameter is used to indicate whether to display the chart title in the rendered image.)
The job of the SalesByYear action is to:
1. Generate the annual sales chart for the requested category and year,
2. Generating the chart image, and
3. Return the chart image's binary contents
Back in the Programmatically Generating Chart Images article, we looked at how to work with charts in lieu of the Chart Web control by programmatically creating the Chart object, setting its properties, specifying its data points, and generating the chart image. To start, we need to create an instance of the Chart object and set properties like the Width and Height:
public ActionResult SalesByYear(string categoryName, int orderYear = 1995, bool showTitle = true)
{
// Create the Chart object and set some properties
var salesChart = new Chart() {
Width = 600,
Height = 400
};
...
Next, we need to plot the chart's data points. There are a variety of ways to do this programmatically, as covered in the Plotting Chart Data installment. If you are going to be frequently creating charts through programmatic means, I recommend that you familiarize yourself with K. Scott Allen's ChartBuilder class, which provides a simple API for plotting the points in a Chart object. (Scott introduced his ChartBuilder class in Charting With ASP.NET And LINQ.)
The following four lines of code uses Scott's ChartBuilder class to create a Sales By Category chart. All of the heavy lifting is handled by the SalesByCategoryChartBuilder class, which we examined in a demo in Plotting Chart Data. (The SalesByCategoryChartBuilder class extends Scott's ChartBuilder class.) In a nutshell, the SalesByCategoryChartBuilder class takes two inputs - the category name and order year - and plots the gross sales for the specified year for all products in the specified category.
var builder = new SalesByCategoryChartBuilder(salesChart);
builder.CategoryName = categoryName;
builder.OrderYear = orderYear;
builder.BuildChart();
After the BuildChart method has completed, the Chart object contains information about its chart areas, series, and, most importantly, its data points, which are the sales figures for each of the products in the specified category. At this point the title has been added to the chart, so we can hide it, if needed.
if (!showTitle)
salesChart.Titles[0].Visible = false;
We are now ready to generate the chart image! The Chart object has a SaveImage method that can save the chart image to a file or a stream. In this case we want to save the image to a stream so that we can send back the binary contents directly to the client without having to first save the image to disk on the web server. To accomplish this, we: create a new MemoryStream object; save the image as a PNG, sending the image contents to the just-created MemoryStream; return to the beginning of the stream; and then return the binary contents of the stream to the client, specifying a content-type of "image/png", which tells the browser that the binary data it is receiving the binary contents of a PNG image.
// Save the chart to a MemoryStream
var imgStream = new MemoryStream();
salesChart.SaveImage(imgStream, ChartImageFormat.Png);
imgStream.Seek(0, SeekOrigin.Begin);
// Return the contents of the Stream to the client
return File(imgStream, "image/png");
}
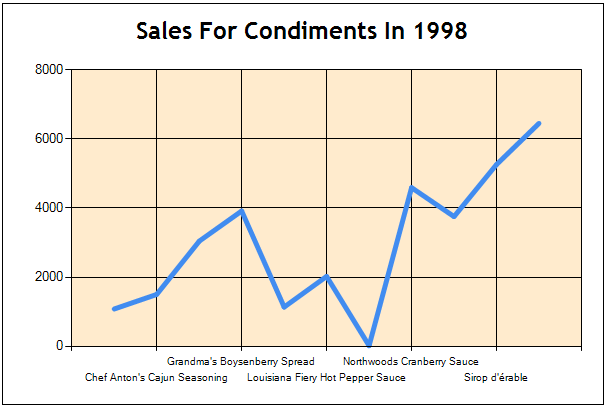
That's all there is to it! With this code in place, visiting www.yoursite.com/Charts/SalesByYear?CategoryName=Condiments&OrderYear=1998 returns the following image:
The sales for Condiments in 1998 chart.

Displaying the Chart in a View
At this point we have a URL that, when visited, generates the chart image and returns it. The next question is, how do we display this chart in a view? Because we have a URL that, when requested, returns an image, we can display this image in a web page by using the <img> element. For example, in the demo application's Home controller's Index view you'll find the following <img> element, which displays the annual sales chart for the Beverages category for 1997:
<div style="text-align: center">
<img ... src="/Charts/SalesByYear?CategoryName=Beverages&OrderYear=1997" />
</div>
To facilitate displaying charts, I added a number of extension methods to the HtmlHelper class - see the MyHtmlHelpers.cs class in the demo. This adds a Chart extension method to HtmlHelper, allowing you to use syntax in your view like <%: Html.Chart(actionName, controllerName, routeValues) %>. This renders an <img> element with the appropriate src attribute. (For more information on creating your own custom HTML helpers, refer to Creating Custom HTML Helpers.) For example, the following syntax renders the same <img> element from the code snipped above:
<div style="text-align: center">
<%: Html.Chart("SalesByYear", "Charts", new { CategoryName="Beverages", OrderYear = 1996 }) %>
</div>
What's more, the Chart extension method also can accept a collection of HTML attributes. For example, the following syntax generates an <img> element whose src attribute references the Charts/SalesByYear?CategoryName=Beverages&OrderYear=1996 URL and whose alt attribute is set to "Beverage sales for 1996."
<div style="text-align: center">
<%: Html.Chart("SalesByYear", "Charts", new { CategoryName="Beverages", OrderYear = 1996 }, new { alt = "Beverage Sales for 1996" }) %>
</div>
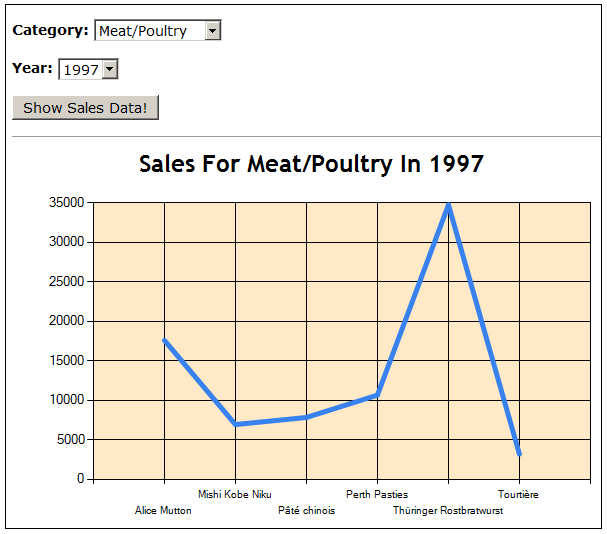
The demo includes two views for displaying the annual sales data. The first one is Home/SalesData, which contains a form with two drop-down lists, one for the set of categories and another for the available years. The screen shot below shows this view in action.
The sales for the Meat/Poultry products in 1997.

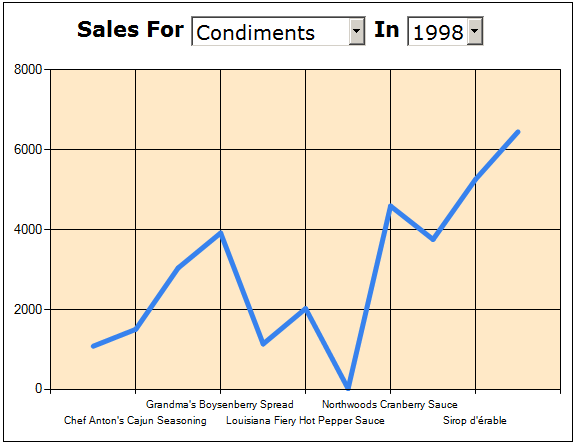
The second view, Home/SalesDataFancy, hides the title in the chart and instead replaces it with text so that the category name and year can be displayed as drop-down lists. In this example, I use JavaScript and jQuery to change the URL of the <img> element whenever the drop-down list selection changes. For example, imagine the user is viewing the sales for the Condiments category for 1998. In that case, the <img> element on the page will have its src attribute referencing Charts/SalesByYear?CategoryName=Condiments&OrderYear=1998. If the user then changes the categories drop-down list to Seafood, rather than doing a postback or requiring the user to click a button, I execute JavaScript code that changes the src of the <img> tag from Charts/SalesByYear?CategoryName=Condiments&OrderYear=1998 to Charts/SalesByYear?CategoryName=Seafood&OrderYear=1998. This has the effect of instantaneously changing the chart and does not require an extra click from the user or the entire page to be reloaded.
The sales for the Condiments products in 1998.

Conclusion
The Microsoft Chart controls include a Chart Web control that simplifies adding charts to an ASP.NET WebForms application. While this Web control can be used in an ASP.NET MVC view, mixing Web controls in MVC views is generally frowned upon. Fortunately, a chart's image can be generated programmatically and its binary contents returned from an action. In this way, it is possible to associate a URL - like Charts/SalesByYear?CategoryName=CategoryName&OrderYear=Year with the image contents of a particular type. Once such a URL has been defined and the action implemented, displaying the chart in a view is as simple as adding an <img> element whose src attribute points to the URL. To simplify this process, I created an extension method for the HtmlHelper class named Chart, which you can find in the demo available for download at the end of this article.
Happy Programming!